
Watch new connections arrive
Every new connection draws an arc on the map, from its country to your network. The same view runs full screen on a NOC wall, a 3D globe included.
FlowSphera reads NetFlow, IPFIX and sFlow from the firewalls, routers and switches you already have — FortiGate, MikroTik, Palo Alto, Cisco, Juniper, Arista and more — and shows who talks to whom. Free up to 5,000 records per second; one command installs it on your own Linux server.
config system netflow
    set active-flow-timeout 60
    config collectors
        edit 1
            set collector-ip <COLLECTOR_IP>
            set collector-port 2055
            set source-ip <FW_LAN_IP>
        next
    end
end
config system interface
    edit "wan"
        set netflow-sampler both
    next
    edit "internal"
        set netflow-sampler both
    next
end/ip traffic-flow set enabled=yes interfaces=all active-flow-timeout=1m
/ip traffic-flow target add dst-address=<COLLECTOR_IP> port=2055 version=9Device > Server Profiles > NetFlow > Add
Template refresh rate 1 minute
Active timeout 1 minute
NetFlow Server <COLLECTOR_IP> port 2055
PAN-OS Field Types tick (adds App-ID and User-ID names)
Network > Interfaces > each inside AND each Internet-facing interface
Advanced > NetFlow Profile = the profile above
Commitflow record FT-REC
match ipv4 source address
match ipv4 destination address
match ipv4 protocol
match transport source-port
match transport destination-port
match interface input
match flow direction
collect interface output
collect counter bytes long
collect counter packets long
collect timestamp sys-uptime first
collect timestamp sys-uptime last
flow exporter FLOWSPHERA
destination <COLLECTOR_IP>
transport udp 2055
template data timeout 60
flow monitor FT-MON
exporter FLOWSPHERA
record FT-REC
cache timeout active 60
interface GigabitEthernet0/0/0
ip flow monitor FT-MON input
ip flow monitor FT-MON outputAlso: Juniper, Check Point, SonicWall, Huawei, Arista, HPE Aruba, VyOS, pfSense and OPNsense, and Linux with pmacct. Anything that exports NetFlow, IPFIX or sFlow works, and the Connect device dialog has a ready-made configuration for each of these.
Every new connection draws an arc on the map, from its country to your network. The same view runs full screen on a NOC wall, a 3D globe included.
Every device that exports flows, its neighbours and the traffic on each link, as both ends recorded it.
A real gap is shown only when traffic goes in and nothing comes back.
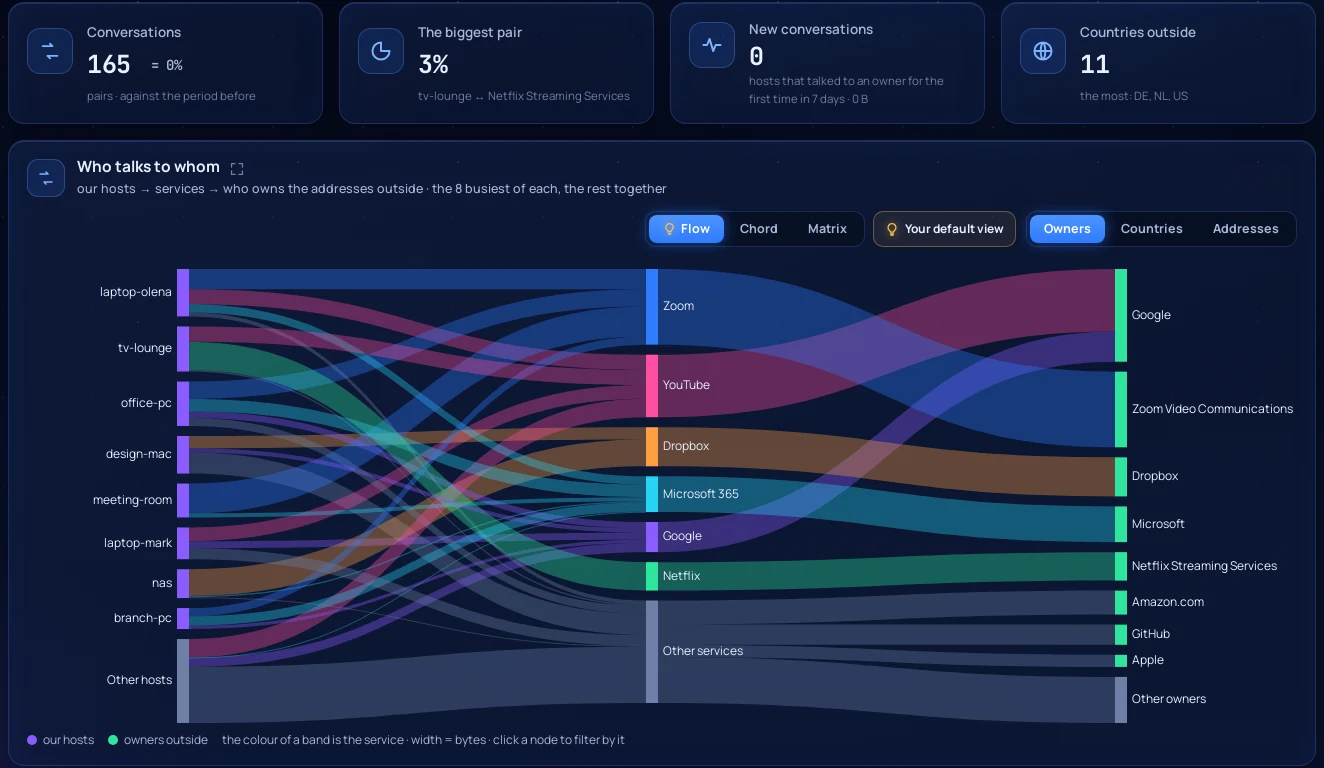
Pairs of hosts and the services between them, and which conversations appeared for the first time.
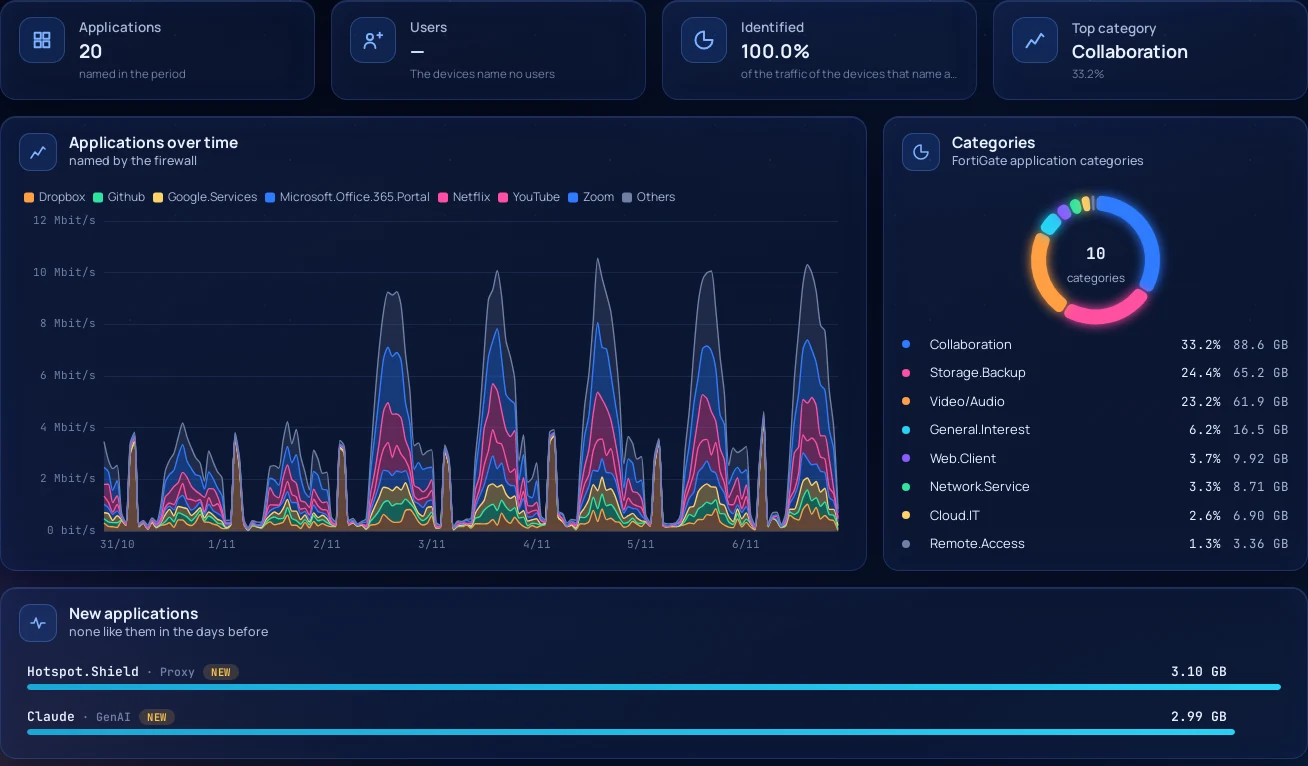
FortiGate application names with their categories. For Palo Alto, App-ID and User-ID names once PAN-OS Field Types is ticked.
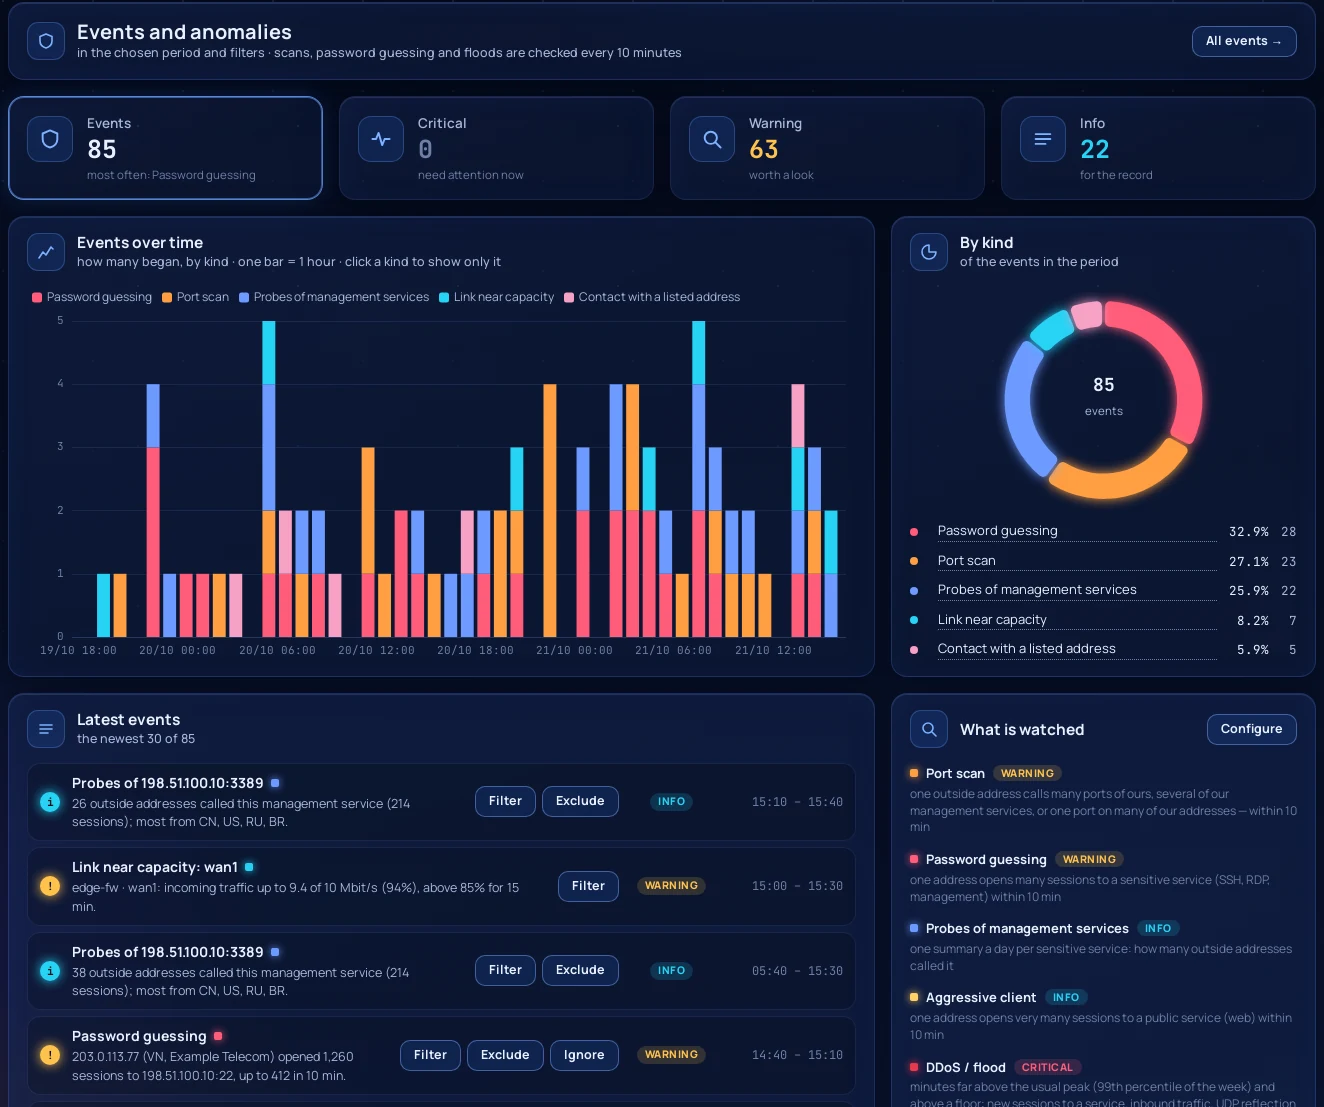
Port scans, password guessing, floods, contact with known malicious addresses, links running full.
Alerts go to Telegram, e-mail, webhooks and your SIEM.
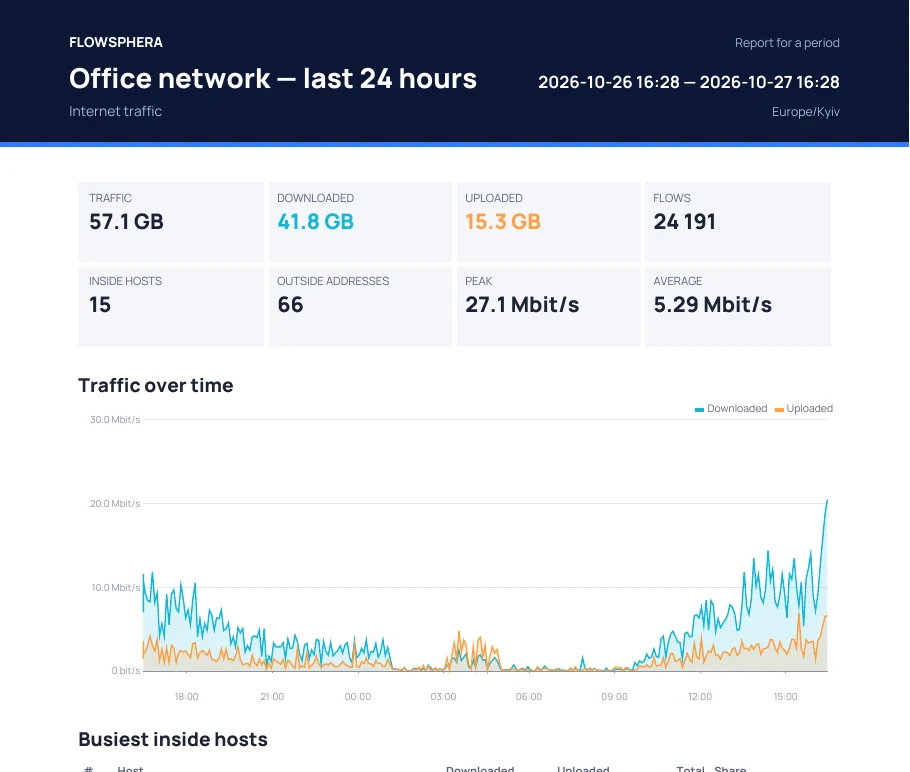
Daily, weekly or monthly by e-mail, or for exactly the incident on your screen.
First, install it on a Linux server.
curl -fsSL https://raw.githubusercontent.com/telesphera/flowsphera/main/install.sh | sudo bashThe installer sets up the database and the web interface over HTTPS, then prints the address and a ready-made configuration for your device.
Then point your device at it. On MikroTik that is two lines.
/ip traffic-flow set enabled=yes interfaces=all active-flow-timeout=1m
/ip traffic-flow target add dst-address=<FLOWSPHERA_IP> port=2055 version=9
FortiGate, Palo Alto and Cisco take a few more; the configuration for each is in the tool above and in the guides.

Then open the map.
Records start appearing within a minute. The overview shows the whole network at a glance.

Up to 5,000 flow records per second and 30 days of history. Every feature included. Covers homes and small and medium offices.
Install CommunityA license for one server: no records-per-second limit (or your own), and longer history, for example 90 days. Every feature is already in Community.
Ask for a quoteWe answer by e-mail. Nothing is sent until you press the button.